The E2E test fails with a timeout. The screenshot shows an infinite spinner. The only useful information is “something in the backend didn’t respond.” Playwright tests verify the user journey — login, add to cart, checkout. But a microservices checkout flows through 4 different services, and when the test times out, Playwright only sees the frontend. The backend remains a black box.
Connecting Playwright tests to OpenTelemetry traces breaks that black box: when a test fails, you open the trace in Grafana and identify exactly which microservice is responsible.
Related reading:
What we cover:
- Quick MockMart setup (demo environment)
- Keycloak authentication with
storageState - Trace correlation: from test to backend
- Visual testing as a complement
- Limits and gotchas
MockMart: demo environment in 5 minutes
MockMart is a demo e-commerce application with a microservices architecture, instrumented with OpenTelemetry:
Gateway (nginx:80)
├── Shop UI (:3000)
├── Shop API (:3001)
│   ├── Inventory (:3011)
│   ├── Payment (:3010)
│   └── Notification (:3009)
├── Keycloak (:8080)
└── Grafana (:3005)
# Clone and start
git clone https://github.com/monte97/MockMart
cd MockMart
make up
# Verify all containers are healthy
make healthTest credentials:
| Username | Password | Role |
|---|---|---|
| mario | mario123 | User |
| admin | admin123 | Admin |
| blocked | blocked123 | User (checkout blocked) |
The app is available at http://localhost. The Playwright project is in demo/mockmart-e2e/ in the workshop repository.
Log in once, reuse everywhere
Before we start, let’s address an awkward situation. The application uses Keycloak for authentication. In an E2E context, you’d normally repeat the full OAuth flow for every test — a significant source of slowdown. Playwright solves this with storageState: run the login once, save cookies and localStorage, reuse them across all tests.
Authentication file setup
// tests/auth.setup.ts
import { test as setup, expect } from '@playwright/test';
const authFile = '.auth/mario.json';
setup('authenticate as mario', async ({ page }) => {
await page.goto('/');
await page.getByTestId('login-button').click();
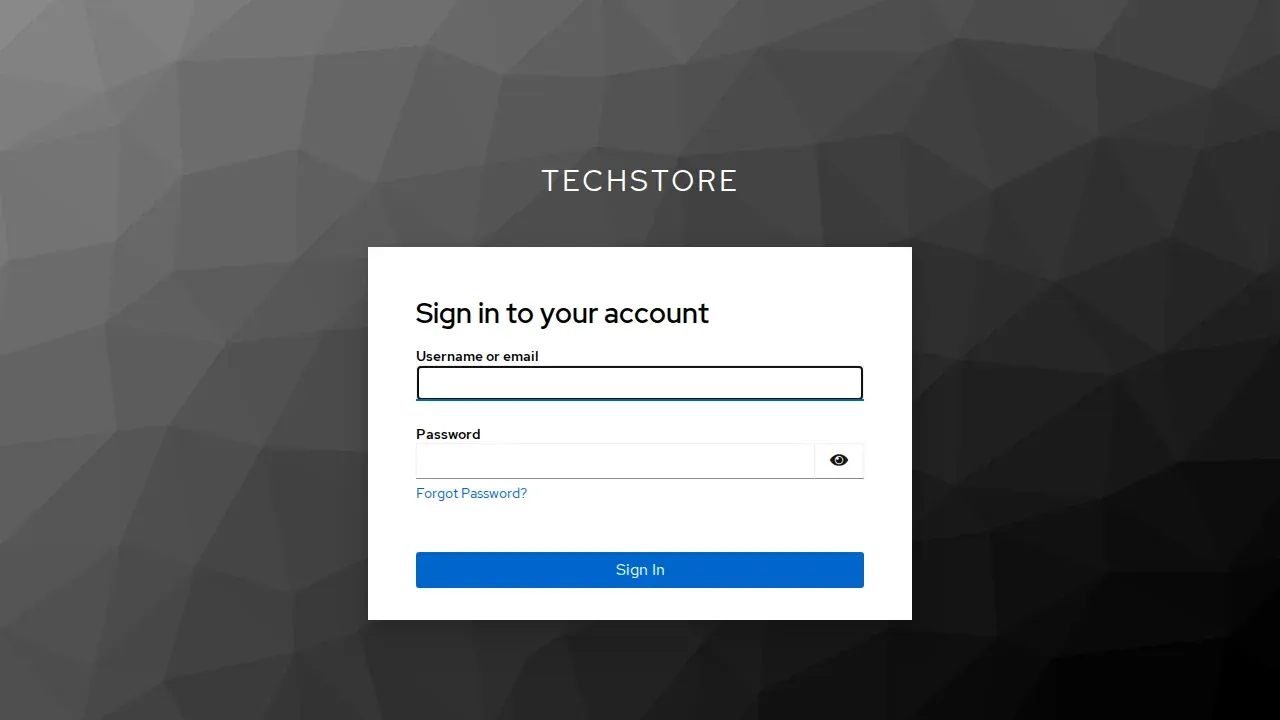
// Keycloak login form
await page.getByRole('textbox', { name: 'Username' }).fill('mario');
await page.getByRole('textbox', { name: 'Password' }).fill('mario123');
await page.getByRole('button', { name: 'Sign In' }).click();
// Wait for redirect back to the app
await expect(page.getByTestId('user-menu')).toBeVisible();
// Save session (cookies + localStorage)
await page.context().storageState({ path: authFile });
});The
.auth/mario.jsonfile contains session tokens. Add.auth/to.gitignoreto avoid committing credentials to the repository.
Project configuration
// playwright.config.ts
import { defineConfig } from '@playwright/test';

export default defineConfig({
  testDir: './tests',
  use: {
    baseURL: 'http://localhost',
    trace: 'on-first-retry',
    screenshot: 'only-on-failure',
  },
  projects: [
    { name: 'setup', testMatch: /.*\.setup\.ts/ },
    {
      name: 'chromium',
      use: { storageState: '.auth/mario.json' },
      dependencies: ['setup'],
    },
  ],
});
Every test in the chromium project starts already authenticated, with no repeated logins:
// tests/checkout.spec.ts
import { test, expect } from '@playwright/test';

test('checkout as logged user', async ({ page }) => {
  await page.goto('/');
  // Mario is already logged in
  await expect(page.getByTestId('user-menu')).toContainText('mario');

  // Add product and complete checkout
  await page.getByTestId('product-card').first().click();
  await page.getByRole('button', { name: 'Add to cart' }).click();
  await page.getByTestId('cart-icon').click();
  await page.getByRole('button', { name: 'Checkout' }).click();
  await page.getByRole('button', { name: 'Confirm order' }).click();

  await expect(page.getByTestId('order-confirmation')).toBeVisible();
});
The test fails, but the bug is in the backend
The problem
The checkout test fails with a timeout:
FAILED tests/checkout.spec.ts:15:5 › checkout as logged user
Error: Timeout 30000ms exceeded.
  waiting for getByTestId('order-confirmation')
The API request was sent. But which of the 4 microservices (Inventory, Payment, Notification, DB) caused the problem? The test verifies user behavior, but user behavior depends on 4 services that the test can’t observe.
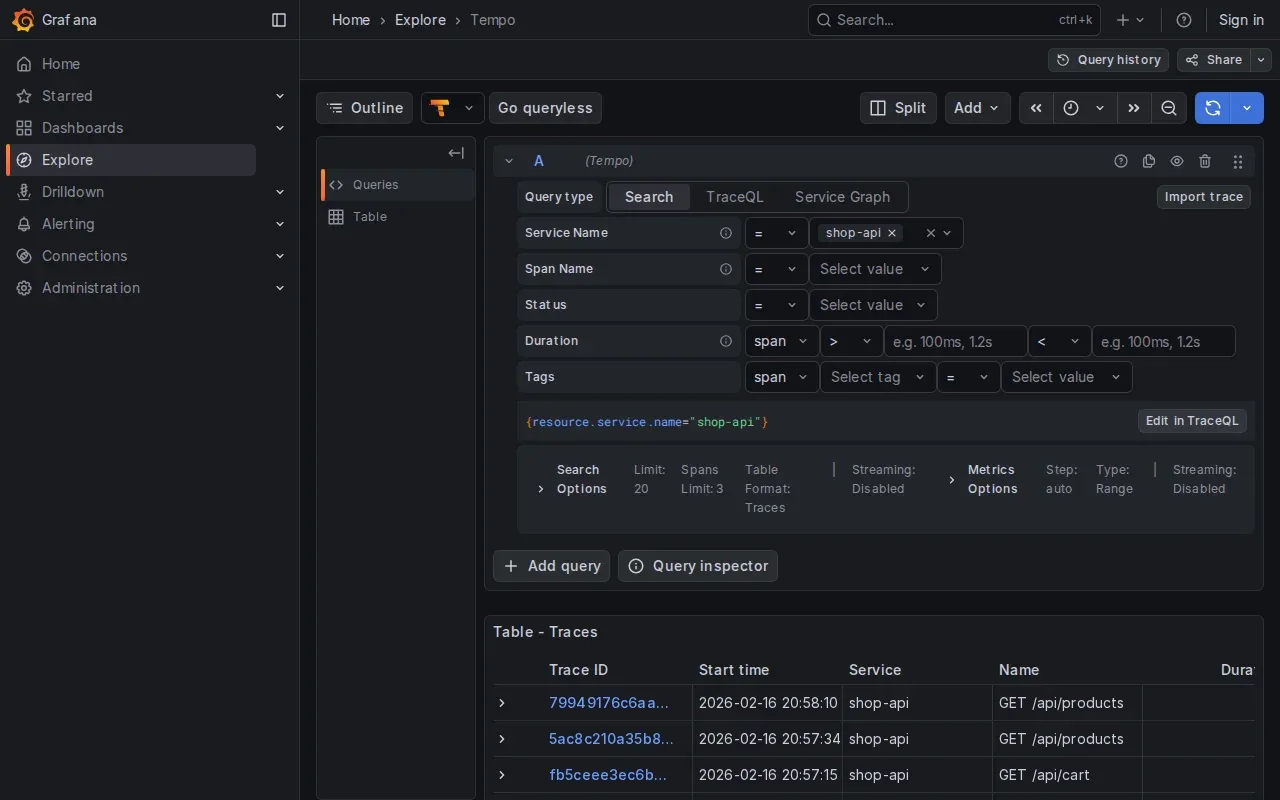
Trace correlation: how it works
MockMart is instrumented with OpenTelemetry. Every HTTP request generates a trace that traverses all involved services:
POST /api/checkout (trace: abc123)
├─ Inventory check (abc123)
├─ Payment process (abc123)
├─ Inventory reserve (abc123)
├─ DB save (abc123)
└─ Notification (abc123)
The backend propagates the trace ID following the W3C Trace Context standard via the traceparent header:
traceparent: 00-0af7651916cd43dd8448eb211c80319c-b7ad6b7169203331-01
                 ^^^^^^^^^^^^^^^^^^^^^^^^^^^^^^^^
                 This is the trace ID (32 hex chars)
The W3C standard defines traceparent as a request header for propagation between services. For it to be available in HTTP responses (and therefore capturable by Playwright), the backend must be configured to propagate it. MockMart already does this. If your backend doesn’t support it, you’ll need to configure it server-side.
By capturing this header from responses in the Playwright test, you can search for the trace in Grafana and see exactly what happened in the backend.
Implementation: trace-collector.ts
The following fixture intercepts responses, extracts trace IDs, and automatically prints them when a test fails:
// fixtures/trace-collector.ts
import { test as base } from '@playwright/test';

interface TraceInfo {
  traceId: string;
  url: string;
  status: number;
  timestamp: Date;
}

interface TraceCollector {
  traces: TraceInfo[];
  getTraceIds(): string[];
  getGrafanaLinks(): string[];
  printSummary(): void;
}

function parseTraceparent(header: string | null): string | null {
  if (!header) return null;
  const parts = header.split('-');
  if (parts.length < 2) return null;
  const traceId = parts[1];
  if (traceId.length !== 32) return null;
  return traceId;
}

export const test = base.extend<{ traceCollector: TraceCollector }>({
  traceCollector: async ({ page }, use, testInfo) => {
    const traces: TraceInfo[] = [];

    page.on('response', (response) => {
      const traceparent = response.headers()['traceparent'];
      const traceId = parseTraceparent(traceparent);

      if (traceId) {
        traces.push({
          traceId,
          url: response.url(),
          status: response.status(),
          timestamp: new Date(),
        });
      }
    });

    const collector: TraceCollector = {
      traces,

      getTraceIds() {
        return [...new Set(traces.map(t => t.traceId))];
      },

      getGrafanaLinks() {
        const baseUrl = process.env.GRAFANA_URL || 'http://localhost/grafana';
        // URL format compatible with Grafana 10.x+
        return this.getTraceIds().map(id =>
          `${baseUrl}/explore?schemaVersion=1&panes={"traceId":{"datasource":"tempo","queries":[{"query":"${id}","queryType":"traceql"}]}}`
        );
      },

      printSummary() {
        console.log('\n--- Trace Summary ---');
        console.log(`Requests traced: ${traces.length}`);
        console.log(`Unique traces: ${this.getTraceIds().length}`);
        console.log('\nGrafana Links:');
        this.getGrafanaLinks().forEach(link => console.log(`  ${link}`));
      },
    };

    await use(collector);

    // On failure, automatically print trace info
    if (testInfo.status === 'failed' || testInfo.status === 'timedOut') {
      console.log('\nTest failed — trace info for debugging:');
      collector.printSummary();
    }
  },
});

export { expect } from '@playwright/test';
Demo: debugging a slow checkout
MockMart includes preconfigured error scenarios. Let’s walk through the “latency spike”:
1. Activate the scenario:
cd MockMart
./scripts/scenario-2-latency-spike.sh
This configures the notification service with a 3-second delay.
2. Run the test with a reduced timeout:
npx playwright test checkout --timeout=50003. Output:
FAILED tests/checkout.spec.ts:15:5 › checkout with trace correlation

Test failed — trace info for debugging:

--- Trace Summary ---
Requests traced: 3
Unique traces: 1

Grafana Links:
  http://localhost/grafana/explore?traceId=0af7651916cd43dd8448eb211c80319c
4. Open the link in Grafana. The trace shows the call cascade with timings:
POST /api/checkout                    (3150ms)
├─ POST /api/inventory/check          (5ms)
├─ POST /api/payments/process         (85ms)
├─ POST /api/inventory/reserve        (4ms)
├─ pg.query INSERT orders             (12ms)
└─ POST /api/notifications/order      (3010ms)  ← BOTTLENECK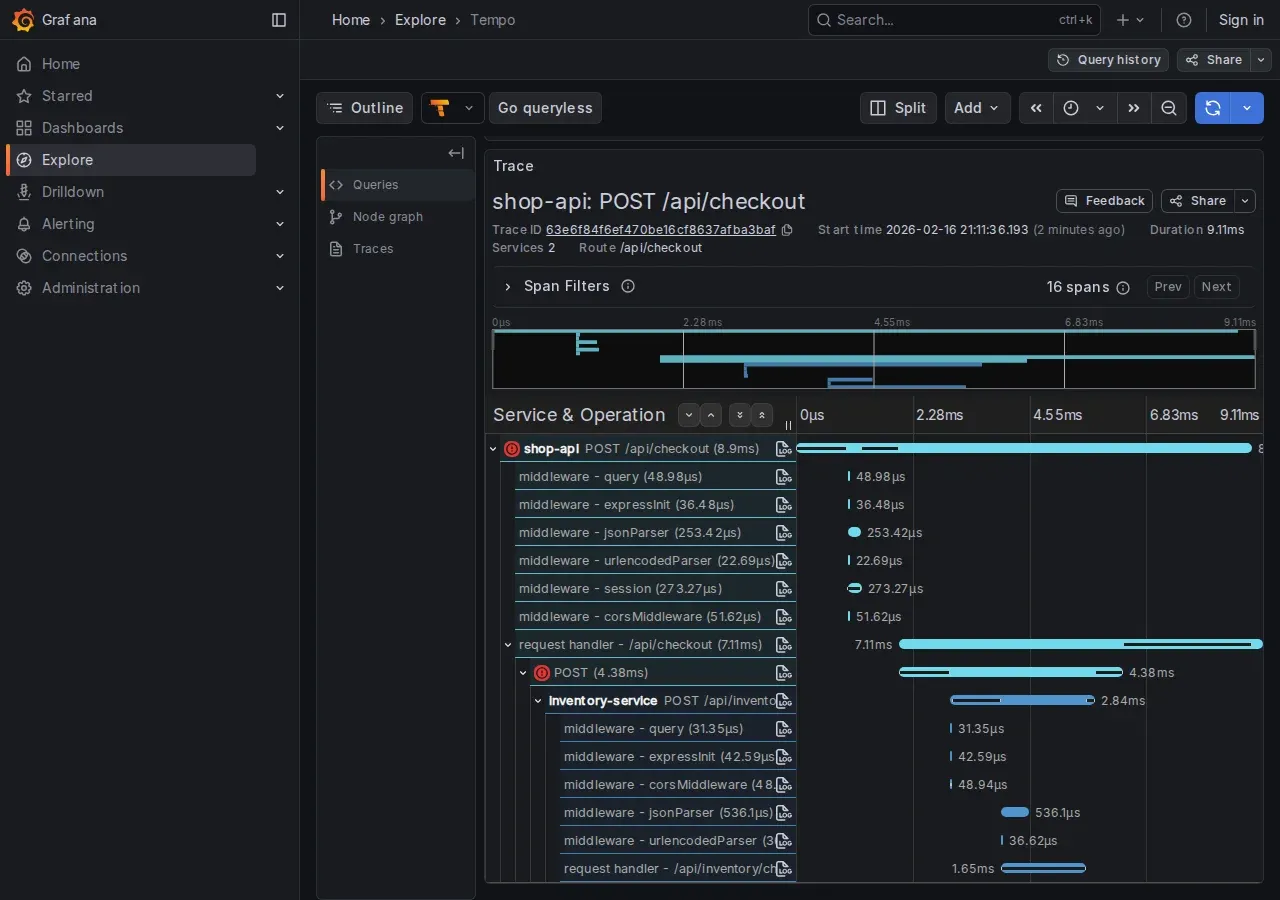
Root cause identified: the notification service takes 3 seconds. Clicking “View Logs” on the slow span:
{
  "msg": "Template rendering took long",
  "renderTimeMs": 3000,
  "template": "order_confirmation_premium"
}
Without trace correlation, we’d have had to guess between 4 services.
Advanced patterns
Injecting a custom trace ID. For a predictable trace ID (useful for searching traces programmatically):
import { randomUUID, randomBytes } from 'crypto';

test('checkout with custom trace', async ({ page }) => {
  const customTraceId = randomUUID().replace(/-/g, '');
  const parentId = randomBytes(8).toString('hex');

  await page.setExtraHTTPHeaders({
    'traceparent': `00-${customTraceId}-${parentId}-01`,
  });

  await page.goto('/');
  // ... checkout flow ...

  console.log(`Trace: http://localhost/grafana/explore?...query=${customTraceId}`);
});
setExtraHTTPHeadersoverwrites all previously set extra headers, including anytraceparentpropagated by the browser. If you need other custom headers, include them in the same call.
In production, traces are often sampled (e.g., 1%). With a custom trace ID, the backend may discard it due to sampling. MockMart in demo mode runs at 100% sampling.
Attaching traces to the HTML report. Grafana links can appear directly in the Playwright report:
// Use `test` imported from '../fixtures/trace-collector'
test.afterEach(async ({ traceCollector }, testInfo) => {
  for (const link of traceCollector.getGrafanaLinks()) {
    testInfo.attach('grafana-trace', {
      body: link,
      contentType: 'text/uri-list',
    });
  }
});
When a visual regression reveals a backend bug
Playwright’s toHaveScreenshot() captures visual regressions. In a microservices app, a visual regression can indicate a backend integration bug, not just a CSS change.
Basic setup
test('visual: order confirmation', async ({ page }) => {
  // ... complete checkout ...

  await expect(page).toHaveScreenshot('order-confirmation.png');
});
The first run saves the reference screenshot. Subsequent runs compare against it and fail if there are significant differences.
Handling dynamic elements
Timestamps, order IDs, and session IDs change on every run. Masking lets you exclude them from the comparison:
test('visual: order confirmation (stable)', async ({ page }) => {
  // ... complete checkout ...

  await expect(page).toHaveScreenshot('order-confirmation.png', {
    mask: [
      page.getByTestId('order-id'),
      page.getByTestId('order-date'),
    ],
  });
});
Integration with trace collector
The real value emerges when you combine visual testing with the trace collector: when a screenshot diff fails, the backend traces show why the UI changed.
import { test, expect } from '../fixtures/trace-collector';

test('visual: payment error with trace', async ({ page, traceCollector }) => {
  // ... trigger payment error ...

  await expect(page.getByTestId('payment-error')).toBeVisible();

  await expect(page).toHaveScreenshot('payment-error.png', {
    mask: [page.getByTestId('timestamp')],
  });

  // If the screenshot diff fails, traceCollector automatically
  // prints Grafana links to identify which microservice
  // responded differently
});
Concrete scenario: the screenshot shows a different error message than the reference. The traces reveal that the payment service now returns {error: 'BLOCKED'} instead of {error: 'USER_BLOCKED'}: a breaking change in the API.
Best practices
- Fixed viewport: configure
viewport: { width: 1280, height: 720 }in the config for consistent screenshots - Font loading: wait for
await page.evaluate(() => document.fonts.ready)before taking a screenshot - Animations: set
reducedMotion: 'reduce'in the config to eliminate variation from CSS animations - CI vs local: rendering varies between operating systems — generate reference screenshots in CI where the environment is controlled
More trace correlation, more data to manage
Connecting E2E tests to OpenTelemetry traces provides an immediate benefit: precise debugging. But it also introduces a data management question worth addressing.
Different environments, different policies
In production, traces are sampled. A sampling rate of 1–10% is the norm: most traffic is normal and will never be consulted. Keeping everything means paying storage for data nobody will look at.
In test environments, you need 100%. Every test exists to verify a specific behavior. If the trace of a failing test was dropped by sampling, the test-to-backend connection is lost, and with it the value of trace correlation.
These are two opposing policies on the same data. Sampling configuration must be managed per environment.
# otel-collector-config.yaml - test environment
processors:
  probabilistic_sampler:
    sampling_percentage: 100  # Capture everything

# otel-collector-config.yaml - production
processors:
  probabilistic_sampler:
    sampling_percentage: 5    # Capture 5%
MockMart in demo mode already runs at 100% sampling. For shared staging or pre-prod environments, the decision needs to be explicit.
Tail-based sampling: keep errors, sample the rest
Probabilistic sampling is simple but blind: it decides whether to keep a trace before knowing how it ends. If a trace containing an error gets dropped, the information is lost.
Tail-based sampling solves this: the Collector gathers all spans of a trace, waits for it to complete, then decides. Typical rules:
- Errors: always keep traces with error spans
- High latency: keep traces with duration above a threshold
- Everything else: sample at the configured rate
# Tail sampling in the Collector
processors:
  tail_sampling:
    decision_wait: 10s    # Time to wait for late-arriving spans
    num_traces: 100000    # Max traces in memory during the wait window
    policies:
      - name: errors-policy
        type: status_code
        status_code: { status_codes: [ERROR] }
      - name: latency-policy
        type: latency
        latency: { threshold_ms: 2000 }
      - name: default
        type: probabilistic
        probabilistic: { sampling_percentage: 5 }
The trade-off: tail sampling requires the Collector to accumulate traces in memory before deciding. decision_wait controls how long — higher values capture late-arriving spans but consume more memory. num_traces limits the number of traces held in memory simultaneously (default 50000): size it based on your environment’s throughput to avoid the Collector prematurely dropping traces. It’s a powerful pattern, but not free.
Retention: how long to keep traces
Beyond sampling, consider retention. In test environments, traces serve immediate debugging or comparison across recent runs. You don’t need traces from six months ago.
| Environment | Sampling | Retention | Rationale |
|---|---|---|---|
| Test/CI | 100% | 7 days | Immediate debug, comparison of recent runs |
| Staging | 20–50% | 14 days | Pre-prod validation |
| Production | 1–5% (+ tail sampling) | 30 days | Incident investigation |
In Grafana Tempo, retention is configured with compactor.compaction.block_retention:
# tempo-config.yaml
compactor:
  compaction:
    block_retention: 168h  # 7 days for test environment
What can go wrong
Backend without traceparent in responses. The fixture only works if the backend propagates the traceparent header in HTTP responses. As described in the trace correlation section, this isn’t standard W3C behavior but a server-side configuration (already active in MockMart). It’s the primary requirement.
Visual testing: local vs CI. Font rendering and antialiasing vary between operating systems. Reference screenshots generated on macOS won’t match those generated on Linux in CI. References must be generated in the same environment where the tests run.
When trace correlation is NOT needed:
| Scenario | Needed? | Why |
|---|---|---|
| Frontend error (typo, broken CSS) | No | The problem is in the test or the UI |
| API call timeout | Yes | The trace shows which service is blocking |
| Wrong data shown in UI | Yes | The trace shows what the backend returned |
| Intermittent flaky test | Yes | Compare traces from passing vs failing runs |
| Monolithic app without OTel | No | No traces to correlate |
Summary
This article connected the world of E2E testing to the world of backend observability:
- storageState for handling Keycloak authentication without repeated logins
- Trace correlation for capturing OpenTelemetry trace IDs and opening them in Grafana when a test fails
- Visual testing integrated with the trace collector for complete regression debugging
- Trace volume management: environment-specific sampling, tail-based sampling to avoid losing errors, differentiated retention
- Concrete limits: header propagation, rendering differences between environments
The result: when a test fails, you don’t have to guess which microservice is responsible. Open the link, read the trace, fix the problem. And with the right policies, this debugging capability doesn’t become an unsustainable cost.
Resources
- Example source code: workshop-playwright/demo/mockmart-e2e
- MockMart Repository: github.com/monte97/MockMart
- W3C Trace Context Spec: w3.org/TR/trace-context
- OpenTelemetry Sampling: opentelemetry.io/docs/concepts/sampling
- Grafana Tempo Retention: grafana.com/docs/tempo
- Playwright Documentation: playwright.dev