Between the rule that fires and the person who must act there is nothing
The four previous articles in the series stopped at the moment a Prometheus rule goes into the firing state: the first two on anticipating the saturation of a physical resource with predict_linear, the other two on alerting on the rate at which the error budget is being consumed with multi-window burn-rate. In both the implicit finish line was the same line of alerting: the PromQL expression that becomes true. But the rule firing is only the start of the path.
The hidden assumption in most alerting repos is that the stretch running from the rule to the person who has to act is a configuration detail, to be settled with a Slack webhook and little else. The consequence is observable in production: precise, well-written alerts that all end up in the same channel, with no differentiated severity, no runbook, and several notifications for the same incident.
The problem is not the PromQL. It is that there is no contract with whoever receives the message.
Three questions a mature alerting repo has to be able to answer, and that this article tries to cover with Alertmanager’s native tools: who receives each alert and with what urgency, what happens when two correlated rules fire together, and what the person opening the notification finds there.
severity is a routing contract, not a label
The severity label in Prometheus rules often gets treated as a descriptive annotation, a tag for telling “how bad it is” while reading the rule. In fact it has a precise operational function: it is the input to Alertmanager’s routing tree. It is the contract between whoever writes the rule and whoever configures the routing, and like any contract it only holds if both sides honour it.
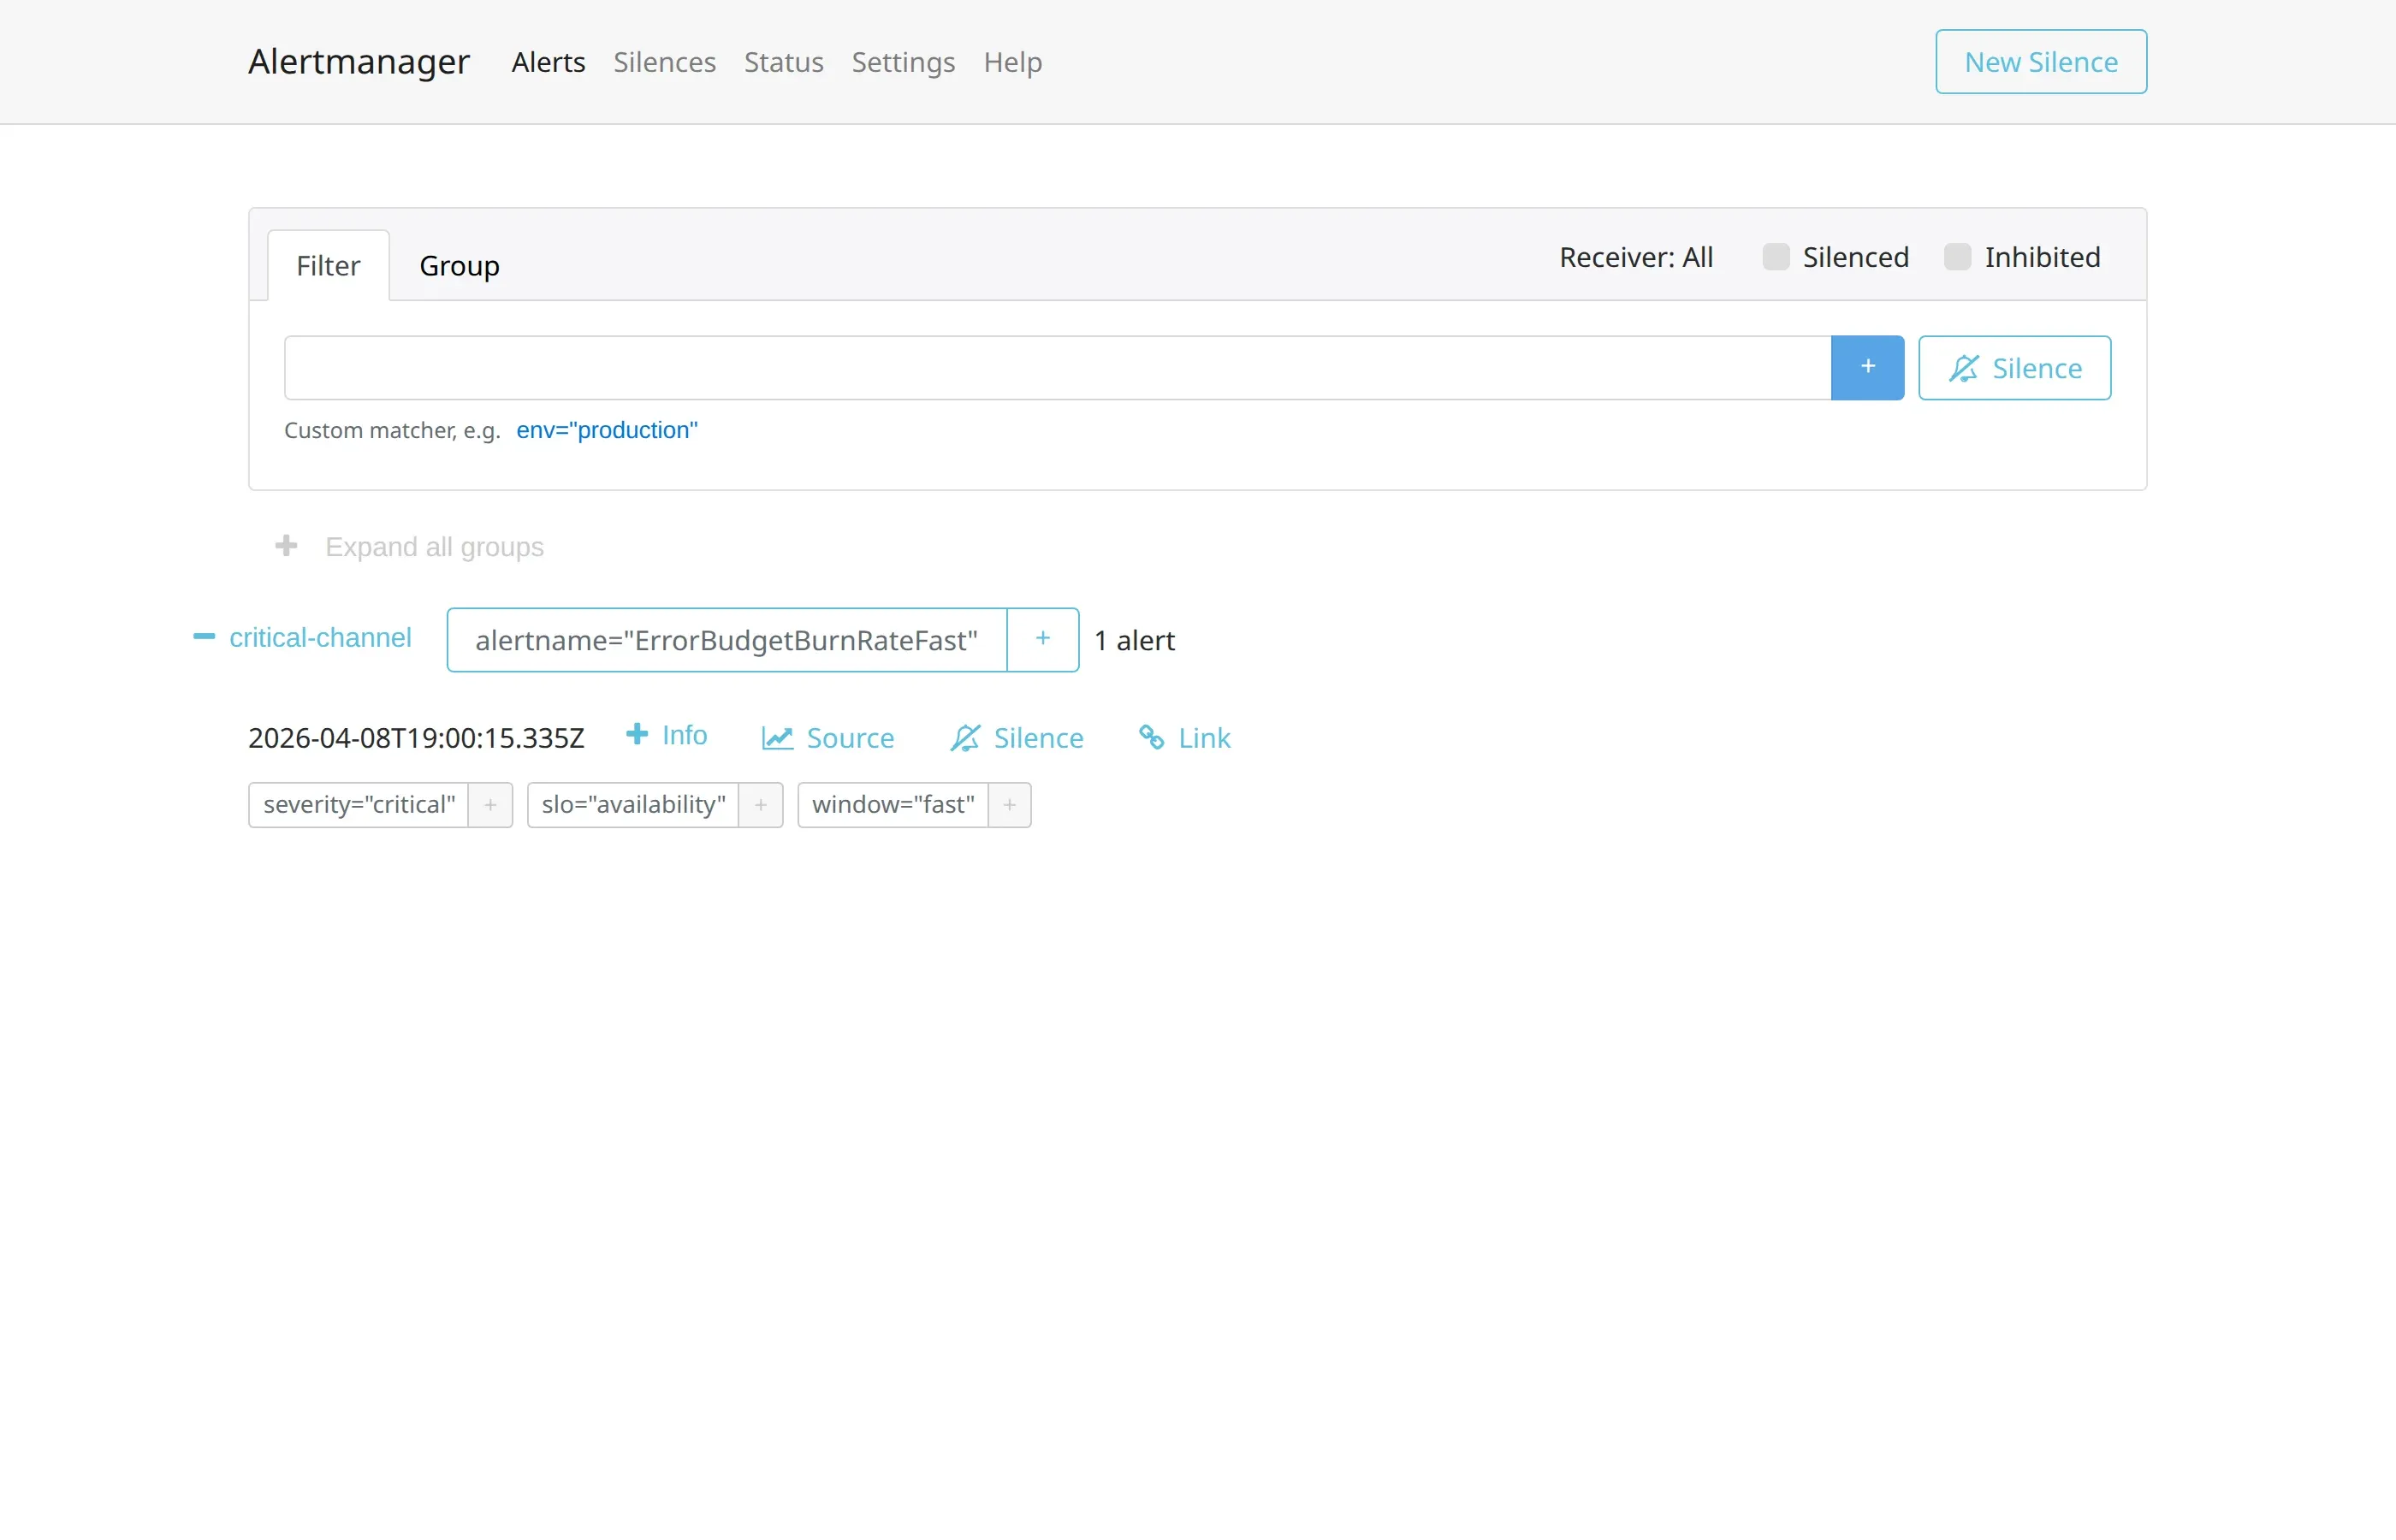
In the series’ demo the two burn-rate rules have different severities: ErrorBudgetBurnRateFast is critical, ErrorBudgetBurnRateMedium is warning. Alertmanager’s routing tree matches on that label and routes each alert to a different receiver:
# alertmanager/config.yml
route:
  receiver: warning-channel
  group_by: [alertname]
  group_wait: 10s
  group_interval: 30s
  repeat_interval: 5m
  routes:
    - matchers:
        - severity="critical"
      receiver: critical-channel

receivers:
  - name: critical-channel
    webhook_configs:
      - url: http://mock-receiver:8080/critical
        send_resolved: true
  - name: warning-channel
    webhook_configs:
      - url: http://mock-receiver:8080/warning
        send_resolved: true
The default route is warning-channel; the child routes intercept alerts with severity="critical" and redirect them to critical-channel. It is a simple strategy, but it is the base building block: any rule routed by severity automatically inherits the behaviour of the corresponding channel — rate limiting, grouping, any integrations towards PagerDuty or Slack — without having to be modified.
Once the stack is up, the Alertmanager UI shows each alert in the group of the correct receiver. The effect is visible directly on the Alerts page:
The concrete advantage is that the severity-to-receiver mapping becomes readable in a single file, rather than scattered across the rules. When the destination channel for critical alerts has to change, you touch only alertmanager.yml, not the dozens of rules that use severity: critical.
One incident, one notification: the inhibit rules
The next problem shows up when two correlated rules fire together. In the demo, the fast burn-rate and the medium burn-rate are designed on purpose to activate in close sequence on high-error conditions: the fast one catches the rapid burn over a short window, the medium one confirms the pattern is sustained. Both describe the same incident seen at two different speeds. Without inhibition, Alertmanager sends two notifications for the same event: one to the critical channel and one to the warning channel.
The inhibit_rules solve this duplication at the Alertmanager level, without touching the Prometheus rules:
# alertmanager/config.yml
inhibit_rules:
  - source_matchers:
      - alertname="ErrorBudgetBurnRateFast"
    target_matchers:
      - alertname="ErrorBudgetBurnRateMedium"
    equal: [slo]
The rule says: when an alert matching source_matchers is firing, suppress every alert matching target_matchers provided they have the same value for the labels listed in equal. In the demo both rules carry the label slo: availability, so the inhibition is targeted at that single SLO. If burn-rate rules for other SLOs were added later (slo: latency, slo: throughput), matching on equal: [slo] would guarantee that the inhibition stays confined to the SLO the fast rule is firing on, without accidentally silencing the medium of a different service.
The Alerts view with the Inhibited filter on shows the behaviour: the medium is present but in the suppressed state, and the Inhibited icon next to the actions confirms Alertmanager is applying the rule.
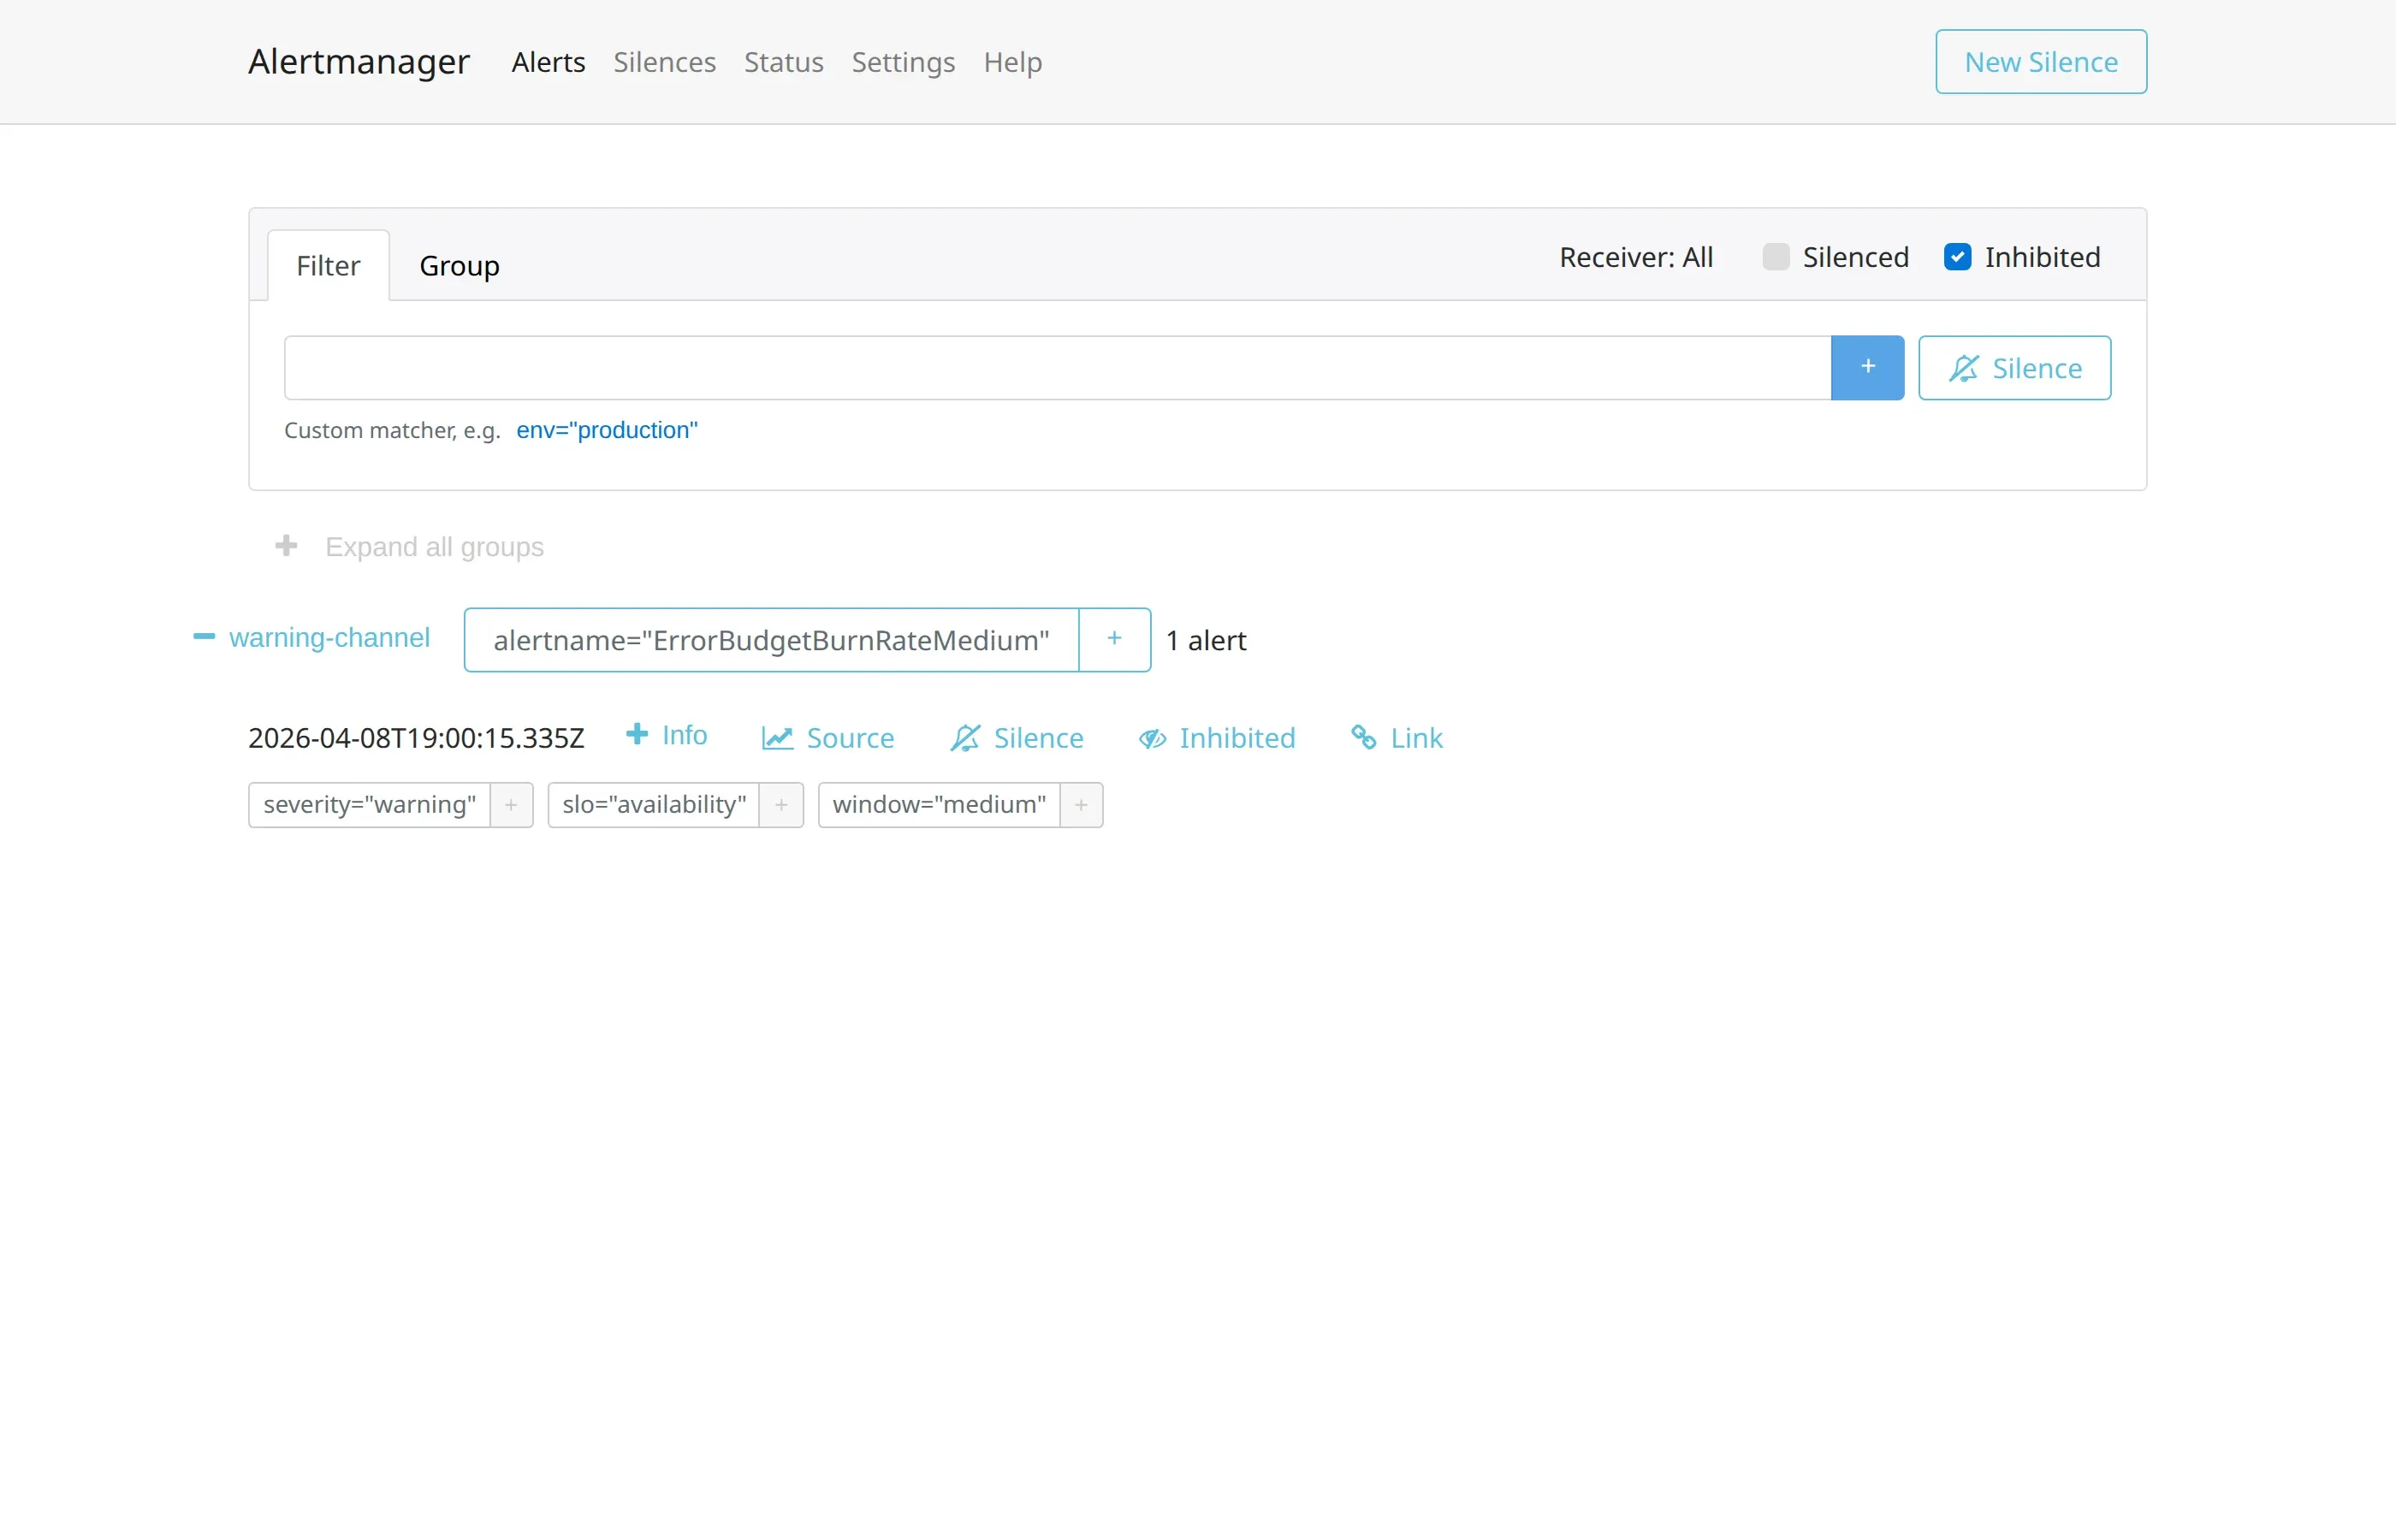
The v2 API makes it explicit in the payload: the inhibited alert reports status.state: "suppressed" and status.inhibitedBy with the fingerprint of the source alert. It is a useful detail for debugging: if an alert you expect does not reach the receiver, the first thing to check is whether something else is inhibiting it.
A rule without a runbook is an incomplete rule
The third building block is the most ignored: what the person opening the notification finds. Alertmanager invents nothing, it propagates what the Prometheus rule declares in the annotations field. If the rule contains no runbook_url, the payload arriving at the channel will not have one.
In the demo both rules declare the annotation:
# prometheus/rules.yml (extract)
- alert: ErrorBudgetBurnRateFast
  expr: ...
  for: 30s
  labels:
    severity: critical
    slo: availability
    window: fast
  annotations:
    summary: "Error budget burning 14.4x faster than target"
    runbook_url: "https://runbooks.example.com/slo-burn-rate-fast"
The mock receiver gets this JSON payload from Alertmanager, and the runbook_url is present both in the individual alert’s annotations and in the group’s commonAnnotations:
[CRITICAL] {
  "receiver": "critical-channel",
  "status": "firing",
  "alerts": [{
    "labels": {
      "alertname": "ErrorBudgetBurnRateFast",
      "severity": "critical",
      "slo": "availability",
      "window": "fast"
    },
    "annotations": {
      "summary": "Error budget burning 14.4x faster than target",
      "runbook_url": "https://runbooks.example.com/slo-burn-rate-fast"
    }
  }],
  "commonAnnotations": {
    "runbook_url": "https://runbooks.example.com/slo-burn-rate-fast"
  },
  "groupKey": "{}/{severity=\"critical\"}:{alertname=\"ErrorBudgetBurnRateFast\"}"
}
The position in the structure matters: a Slack template or a PagerDuty integration can extract commonAnnotations.runbook_url and make it clickable in the message without having to decide which alert of the group to query. This is the typical case where commonAnnotations is the right key and alerts[0].annotations is a fallback.
The operational thesis is simple: runbook_url should be treated as a mandatory field of the rule definition, on the same footing as summary, not as an optional extra. It has to be said that it is not a field formalised in the core Prometheus documentation: it is an ecosystem convention, adopted by kube-prometheus and by the Prometheus Operator, and as such there is nothing forcing its presence. Which is exactly why it is worth imposing it by internal policy. A rule without a runbook is an incomplete rule. The less obvious note holds too: it is better to point at a minimal runbook page that exists — even just three lines saying “check X, ask Y, contact Z” — than at a 404. A broken link erodes trust in the whole notification system, and the oncall stops following them.
Alerting well is not a property of one query
The saturation-alerting series closes with three articles covering different levels of the same question, “when should it be said that something is not working”:
- Physical saturation forecasting (article #1): anticipating the exhaustion of a measurable, monotonically consumed resource, with
predict_linearas the tool. - Multi-window burn-rate (article #2): moving the monitoring from the resource to the user impact, alerting on the rate of error budget consumption instead of on a static threshold.
- Routing, severity, runbook (this article): closing the circle on the operational side, because an elegant PromQL expression reaching the wrong channel, or a recipient without context, produces the same practical effect as having no alert at all.
The common thread is that alerting well is not a property of a single query. It is a property of the system as a whole: from the metric to the rule, from the rule to the routing, from the routing to the payload, from the payload to the person. The three building blocks in this article — severity contract, inhibit rules, runbook_url — cover 70% of the gap between “the rule fires” and “somebody solves the problem”, at low implementation cost and with a very concrete return. The remaining 30% — rule testing, advanced message templating, handling silences, Alertmanager clusters in high availability — is material for later, but none of it makes sense if the three basic blocks are not there.
References
- Alertmanager docs — Configuration
- Alertmanager docs — Webhook receiver
- SRE Workbook ch. 5 — Alerting on SLOs
- Demo code:
burn-rate-demo(GitHub)
What remains open
The declared boundaries of the three building blocks.
- — The three building blocks cover 70% of the gap between a fired rule and a solved problem: rule testing, advanced templating, silences and HA Alertmanager clusters stay out
- — `runbook_url` is not formalised in the core Prometheus documentation: it is an ecosystem convention (kube-prometheus, Operator) that nothing enforces
- — The demo routes to a local mock webhook receiver: real integrations towards PagerDuty or Slack have to be configured in the receivers