There is a recurring moment in observability projects: the system is instrumented, the dashboards work, and a few months later somebody looks at the storage bill and asks whether all those traces are really necessary.
At that point there are two levers available, and both are architectural. Where you put the collection point, and what your storage decides to index. These are decisions you make at the start and pay for over years: changing them later means going back into every service.
This article is about those two choices. The rest of the series — the debugging scenarios and then tail sampling with the cost projections — is about what you do once you have made them.
Before OpenTelemetry every vendor had its own dialect
It is worth recalling why a standard exists, because it explains the shape of everything else.
Before OpenTelemetry, instrumenting an application meant picking a vendor and marrying it. Every platform had its own library, its own format, its own protocol. Changing backend meant going back into every service: not a configuration migration, a code migration.
OpenTelemetry separates three things that used to be a single block:
- how telemetry is generated — the SDK, inside the application
- how it is transported — the OTLP protocol
- where it ends up — the backend, which becomes interchangeable
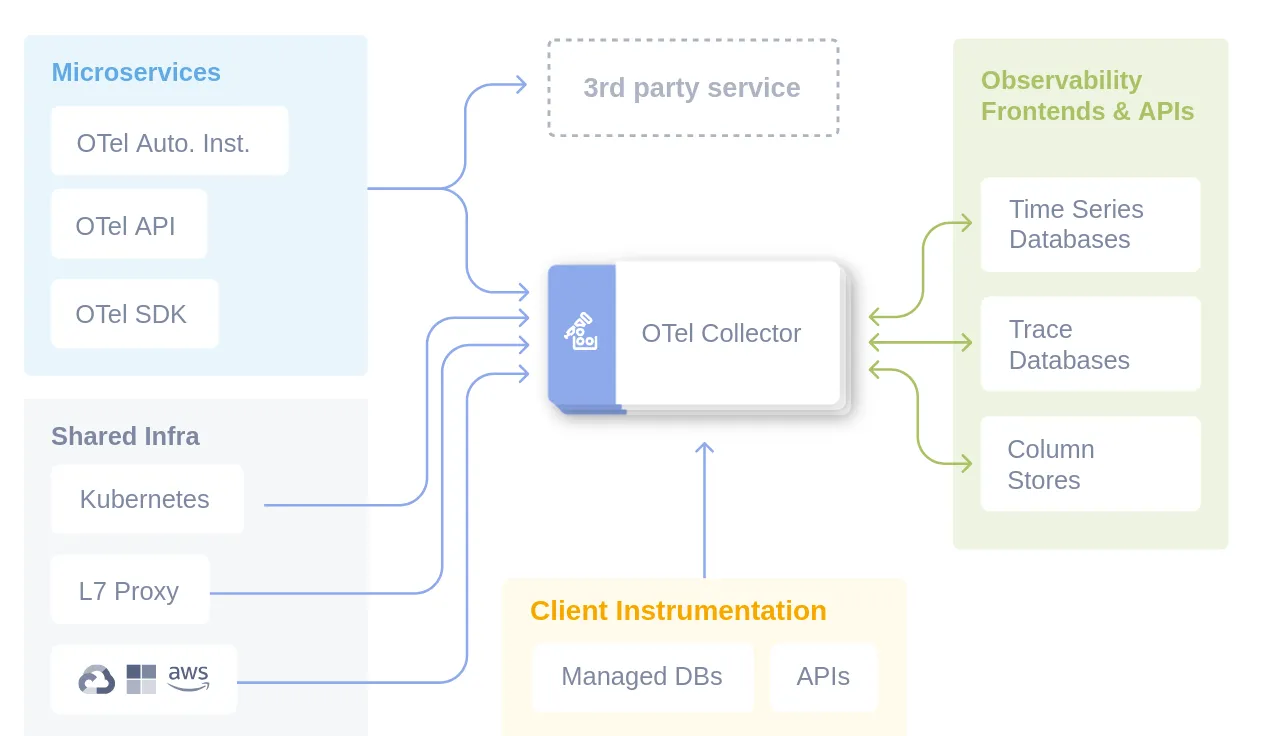
The practical consequence is that the storage vendor stops being an irreversible decision. That is the main reason to adopt the standard even if you are happy with your current backend.
The Collector is where the architecture decouples
The Collector is a separate process that receives telemetry, processes it and forwards it. It looks like an operational detail, and it is instead the choice that determines what you will be able to change without shipping code.
Its pipeline has three stages:
- receiver — accepts incoming data, in OTLP or other formats
- processor — transforms: batching, filtering, enrichment with metadata, removal of sensitive data, sampling
- exporter — sends to one or more destinations
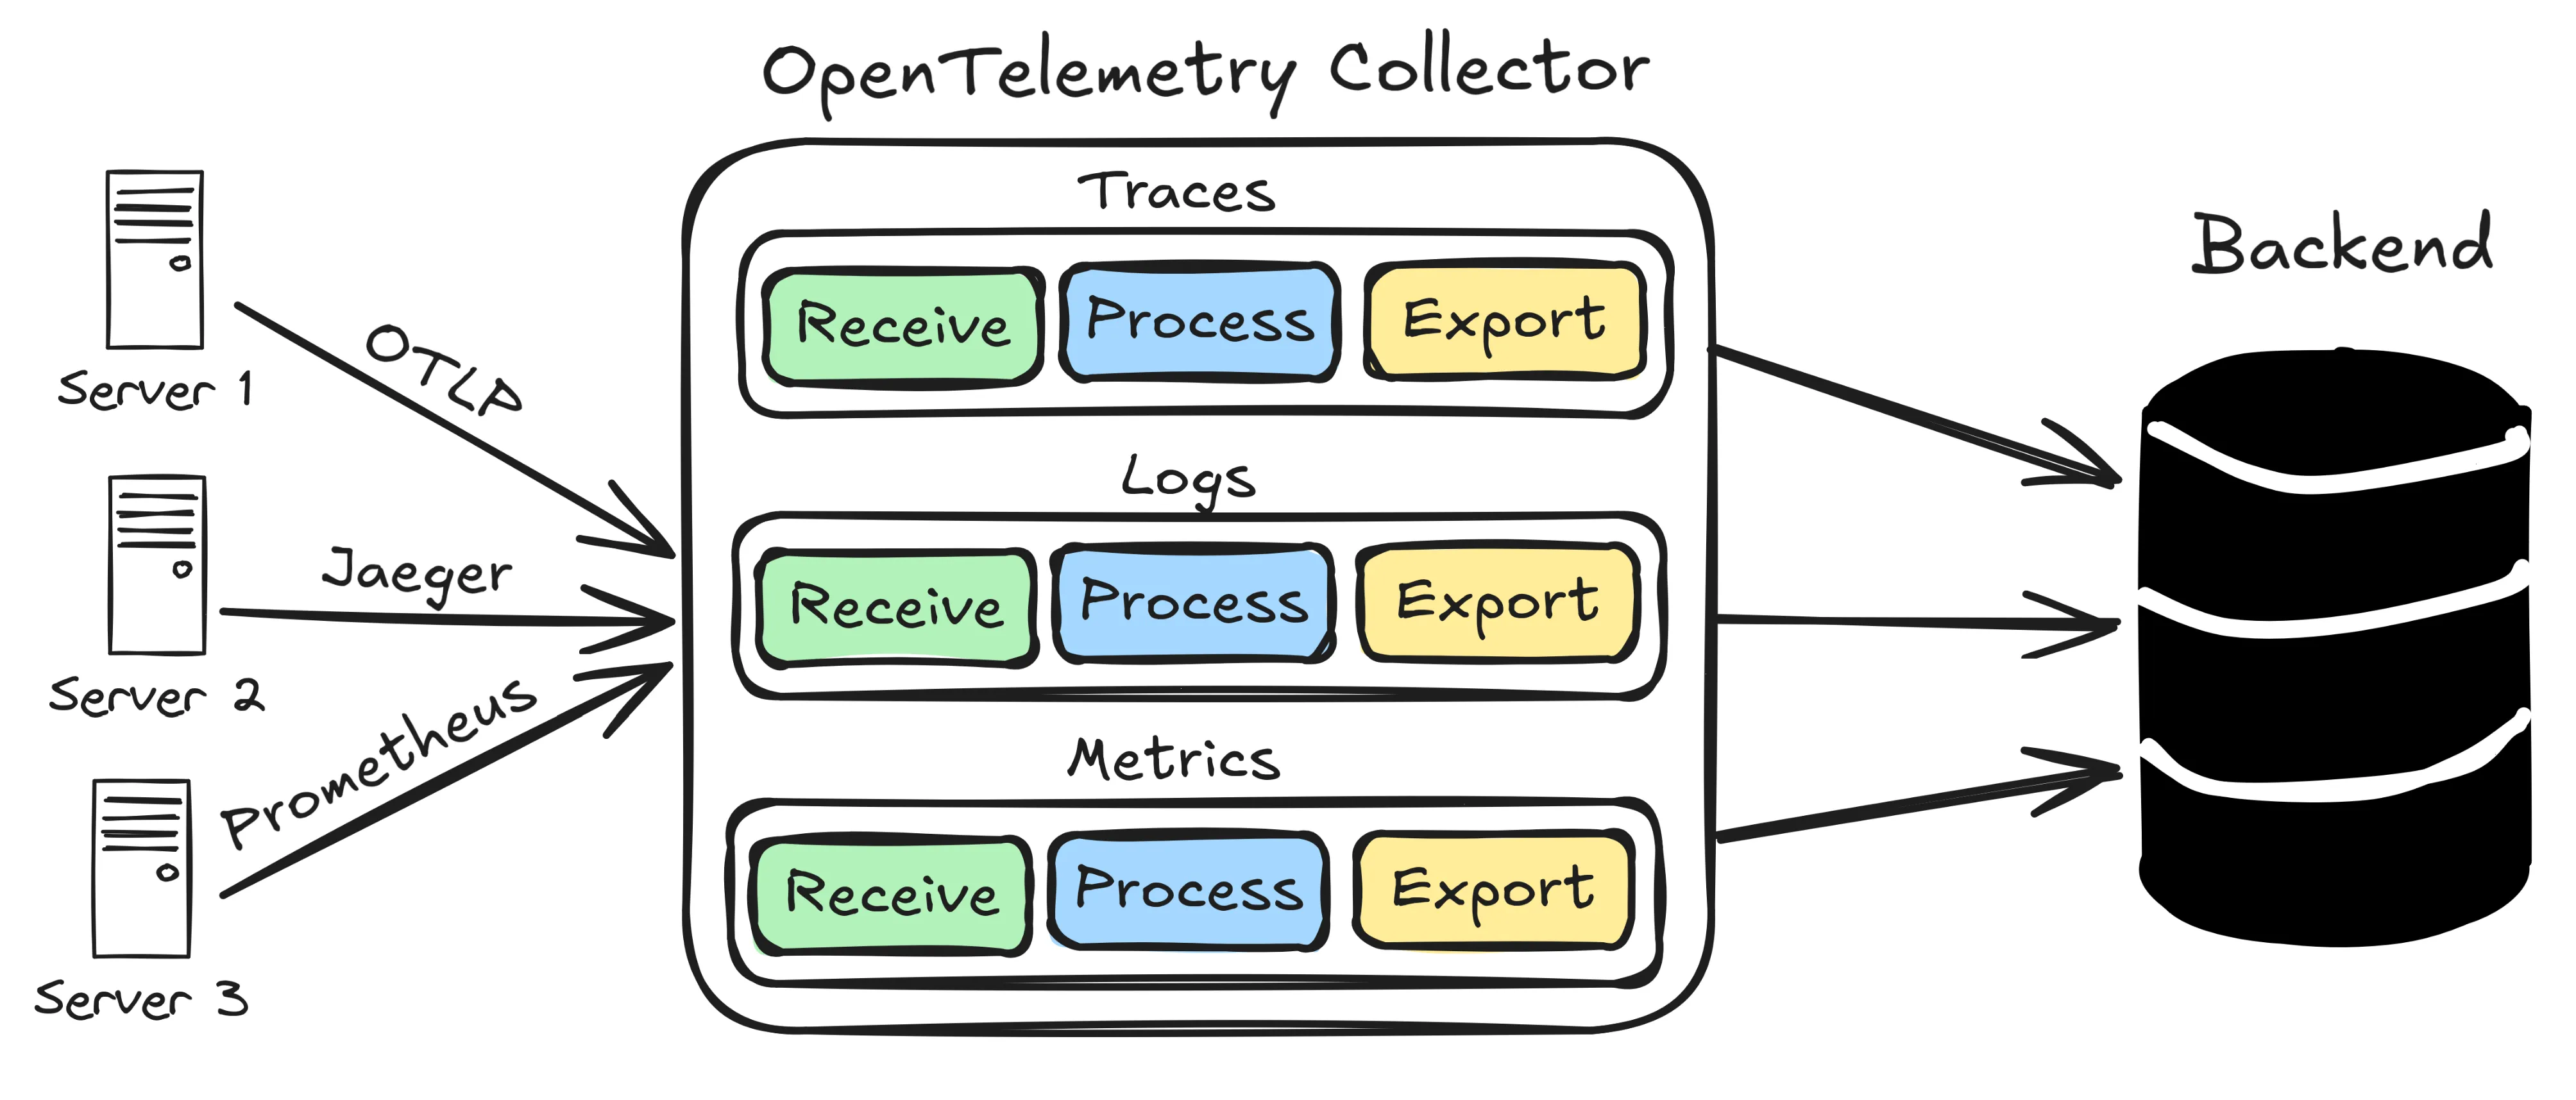
Everything that sits in the Collector is something that does not sit in application code. Filtering personal data before storage, sending audit logs to a different destination from technical ones, reducing volume by sampling: these all become configuration, and they change with a restart instead of a release.
It is also where the risk concentrates. If there is a single Collector and it goes down, you lose the telemetry of everything behind it — which leads to the next question.
Where to put it: sidecar, gateway, or both
Three topologies, each with a different trade-off.
Sidecar — one Collector per service, next to the application.
| For | resource isolation per service, independent scaling, service-specific configuration, and the application never makes network calls to the backend |
| Against | resource consumption multiplied by every instance, and deployment complexity that grows with the number of services |
Gateway — one centralised Collector receiving from everyone.
| For | configuration in one place, shared resources, simple network topology towards the backends |
| Against | single point of failure, added latency between application and gateway, and a scaling bottleneck if undersized |
Hybrid — sidecars for local collection and batching, gateway for the expensive work: tail-based sampling, complex transformations, routing to final destinations.
The rule that falls out of this: tail-based sampling requires seeing the whole trace, so it cannot live in a sidecar that only sees its own service. If you plan to reduce volume by deciding after seeing how a request went — and that is almost always what you want — the gateway is not one option among three: it is a mandatory piece.
What transport costs
Order-of-magnitude numbers, useful for sizing before measuring:
| OTLP uncompressed | ~1 KB per span |
| OTLP over gRPC with gzip | ~200 bytes per span |
| Batches of 1000 spans | ~95% less overhead |
The factor of five between compressed and uncompressed is not an optimisation for later: it is the difference between bandwidth you notice and bandwidth you do not, and it is one line of configuration.
On transport the choice is between two:
- gRPC — binary serialisation, HTTP/2 multiplexing, built-in compression. This is the recommended default.
- HTTP/JSON — slower and more verbose, but it goes through ports 80 and 443 and is readable by eye. You pick it for compatibility with networks that allow nothing else, or while debugging.
Why LGTM is cheap: you index the label, not the content
Here is the second lever, and it explains the cost difference between two stacks that apparently do the same thing.
Traditional log systems index every word. That is why full-text search is powerful, and it is also why the index becomes the dominant cost.
Loki does the opposite: it indexes only labels — app=checkout-service, env=prod — and keeps the raw logs compressed in object storage. A query filters by label first, narrowing the field to a few streams, and only then scans the content:
{namespace="production", app="web-app"} |= "error" != "connection refused"Tempo applies the same principle to traces: it indexes the TraceID only and stores the complete trace in object storage. Retrieving a trace whose identifier you know is immediate.
And here the model shows its condition of validity: it pays off as long as you know where to start. If you arrive with a label or a TraceID, the cost is low. If you have to search blindly across the whole history with no entry point, this model no longer helps you.
Which explains why correlation is not a convenience but an architectural prerequisite: it is the metrics alert that gives you the service, it is the log that gives you the trace_id, and it is that trace_id that makes querying Tempo cheap. Without the thread tying the three signals together, storage built this way becomes exactly as awkward as it is cheap.
The topology in Kubernetes
Putting it all together, the typical deployment:
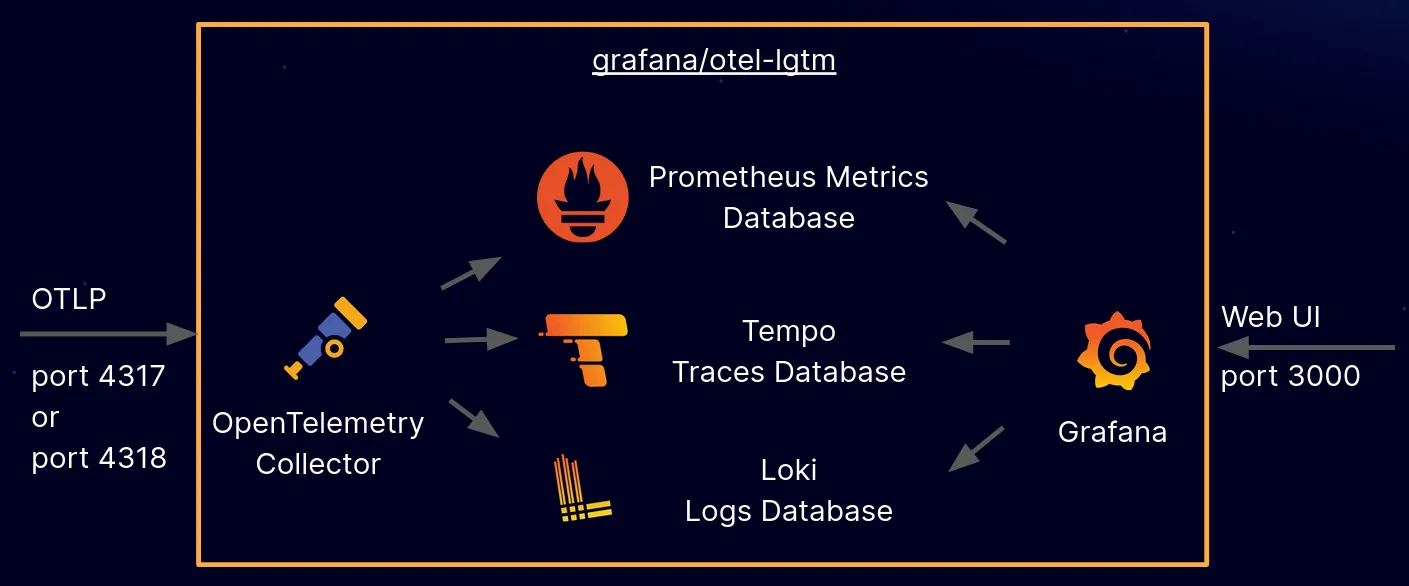
- SDK inside the application, generating
- Collector as a DaemonSet or sidecar, collecting
- Gateway Collector as a scalable Deployment, where the expensive processing lives
- Loki, Tempo and Mimir as backends, with object storage underneath
- Grafana as the single point of reading, correlating the three signals
Every component scales horizontally on its own. Object storage is the common substrate, and it is also why the bill stays predictable: you pay for the volume you keep, not for the index.
What changes for whoever pays
The two choices in this article translate into a sentence that makes sense outside the engineering team: the Collector makes the storage vendor a reversible decision, and the label-based model means keeping more telemetry costs in proportion to volume rather than to the index. Together, they are the difference between an observability budget that grows with traffic and one that grows faster than traffic.
Which is why these decisions are worth making before instrumenting the first service: they are the only two that cost a rebuild afterwards.
What to do now
If you are about to start: put the Collector in from the first service, even if at first it only forwards. The cost is one more container; the benefit is that the day you need to filter, sample or change destination, you do it in one place.
If you are already instrumented and the bill is climbing, the first thing to check is not sampling: it is whether compression is on and batching is configured. Two lines, and they are worth the factor of five in the table above.
The rest — which traces to keep and for how long — is the subject of tail sampling and retention, where the numbers stop being orders of magnitude and become projections against concrete traffic.
What remains open
What this architecture does not decide for you.
- — The transport and overhead figures are indicative of the OpenTelemetry ecosystem, not benchmarks on a specific system: they need re-measuring against your own traffic
- — Choosing between sidecar and gateway depends on how many services there are and who runs them: below a certain scale the gateway is the only sensible option, and that threshold is not universal
- — The Loki and Tempo indexing model pays off as long as queries start from a label or a TraceID: full-text search across the whole history stays expensive
- — This is about architecture and unit costs, not about how much volume you will produce: that measurement only comes from real traffic